UpSet Plot's 10-Year Journey: Award-Winning Data Visualization Tool
In the dynamic world of data visualization, where clarity and insight are paramount, certain innovations stand the test of time, proving indispensable for researchers and analysts alike. The
UpSet plot is one such innovation. Introduced a decade ago, this sophisticated visualization technique has not only transformed how we understand complex set intersections but has also recently garnered the prestigious 10-year Test of Time Award at IEEE VIS 2024, a testament to its enduring impact and foundational contribution to the field.
At its core, the
UpSet plot provides a powerful and scalable alternative to traditional Venn and Euler diagrams, especially when dealing with more than three sets. It’s a tool designed for the quantitative analysis of overlapping data, revealing the intricate relationships and cardinalities of intersections that would otherwise remain hidden in large, multi-set datasets. From its humble beginnings in 2014, conceived by Alexander Lex and his colleagues, the
UpSet plot has evolved, culminating in the release of UpSet 2.0, reinforcing its status as an award-winning data visualization solution.
The Genesis of UpSet: Overcoming Visualization Hurdles
Before the advent of the
UpSet plot, visualizing the overlaps between multiple sets was a significant challenge. Traditional Venn and Euler diagrams, while intuitive for two or three sets, quickly become unwieldy and inaccurate as the number of sets increases. The limitations are profound:
- Combinatorial Explosion: For 'k' sets, there are 2^k possible intersections. Even with a modest number of sets, say six or seven, the number of regions becomes enormous, making the diagram impossible to draw clearly or interpret.
- Area-Based Inaccuracy: Venn and Euler diagrams rely on the proportional area of regions to represent intersection sizes. Accurately drawing these areas for multiple sets is geometrically challenging, leading to visual distortions and hindering precise quantitative comparisons.
- Clutter and Readability: With too many overlapping shapes and labels, these diagrams become cluttered, difficult to read, and fail to convey meaningful insights.
This inherent struggle to visualize complex set intersections was the driving force behind the development of the
UpSet plot. Lex and his team recognized the need for a scalable, precise, and user-friendly method to analyze these relationships. Their solution fundamentally shifted the paradigm from area-based representations to a matrix-based approach, offering unprecedented clarity and analytical depth.
How UpSet Works: A Deep Dive into its Mechanics
The ingenuity of the
UpSet plot lies in its innovative matrix-based layout and linked views, which together provide a comprehensive analysis of set intersections. Instead of relying on overlapping shapes,
UpSet organizes information in a structured, quantitative manner.
Understanding the Core Components:
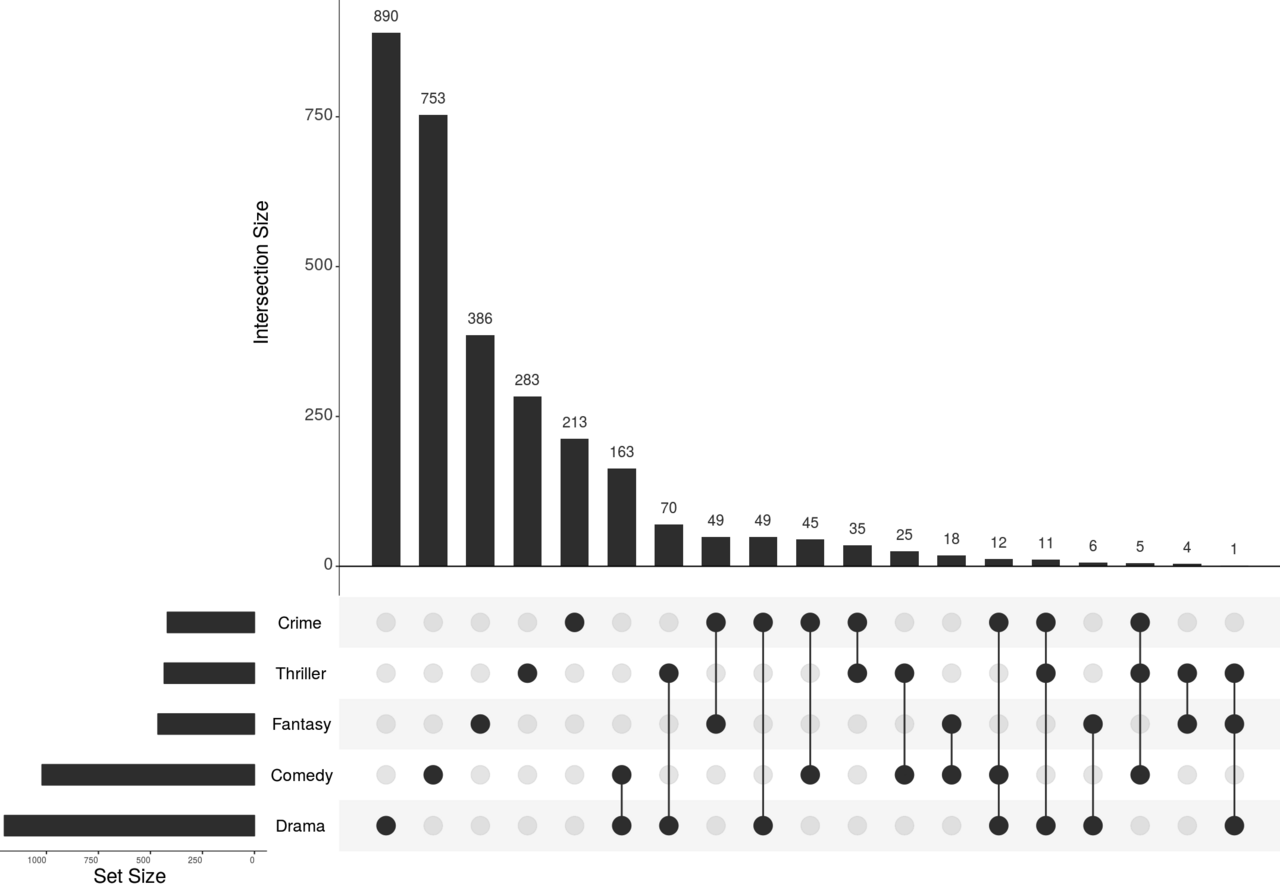
- The Intersection Matrix: This is the heart of the UpSet plot. It presents rows representing specific combinations of set intersections and columns corresponding to individual sets. Visual encodings, typically dots and connecting lines, clearly indicate which sets participate in each intersection. This design eliminates the visual clutter associated with traditional diagrams.
- Cardinality Bars: Positioned alongside the matrix, these bars precisely encode the size of each intersection using length, not area. This is a critical feature, enabling accurate and immediate quantitative comparisons between different intersections, a capability severely lacking in Venn diagrams for numerous sets.
- Sorting Options: To facilitate deeper analysis, UpSet plots offer flexible sorting capabilities. Users can arrange intersections by measures such as cardinality (size), the degree of intersection (number of participating sets), or even deviation from expected values, allowing specific patterns to emerge.
- Aggregation Mechanisms: For extremely large numbers of non-empty intersections, UpSet allows for aggregation, grouping intersections by criteria like the number of participating sets (degree-based) or user-defined queries. This helps manage complexity without losing critical information.
Interlinked Views for Enhanced Exploration:
The
UpSet plot experience is further enriched by its two interconnected views, fostering interactive and task-driven analysis:
- Set View: This primary view focuses on the intersections and their aggregates. It’s often augmented with summary statistics, such as box plots, for attributes of the elements within each intersection, offering immediate context.
- Element View: This view displays individual data points that constitute the intersections. Users can visualize detailed attribute distributions using tools like scatterplots or histograms, gaining granular insights.
Crucially, queries propagate bidirectionally between these views. Selecting an intersection in the set view instantly filters and highlights the corresponding elements in the element view. Conversely, applying attribute-based filters in the element view refines the set analysis, making the tool incredibly versatile for exploratory data analysis. This interactive nature is a key reason for its popularity and effectiveness, allowing users to
Mastering UpSet Plots: Visualizing Complex Set Intersections with greater ease.
A Decade of Impact: The IEEE VIS Test of Time Award
The year 2024 marks a significant milestone for the
UpSet plot: it received the prestigious 10-year Test of Time Award at IEEE VIS, the premier conference for visualization research. This award is not merely a recognition of past achievement; it celebrates a work that has demonstrated enduring influence, inspired subsequent research, and remains highly relevant and impactful a decade after its initial publication.
The award underscores several key aspects of
UpSet's contribution:
- Foundational Innovation: It provided a robust solution to a long-standing problem in data visualization, becoming a standard for analyzing multi-set data.
- Widespread Adoption: From genomics to social network analysis and bibliographic data, UpSet has found application across diverse scientific and commercial domains. Its open-source, web-based implementation (using JavaScript and D3.js) has made it widely accessible.
- Catalyst for Further Research: The core ideas behind UpSet have spurred further innovation in set visualization and interactive data exploration.
- Practical Utility: Its emphasis on task-driven insights, such as identifying the largest overlaps or patterns in set relationships, provides tangible value to users.
The fact that the
UpSet plot continues to be a go-to tool for visualizing set data, even as the field of data visualization rapidly evolves, speaks volumes about its thoughtful design and the critical need it addresses. It’s often considered when researchers realize the limitations of
UpSet Plot vs. Venn: Unlocking Data Insights for Many Sets for their complex datasets.
UpSet 2.0 and Beyond: Evolving for the Future
Coinciding with its award, the release of UpSet 2.0 demonstrates the continued commitment to enhancing this powerful visualization tool. UpSet 2.0 retains the core, award-winning features while introducing significant improvements focused on usability and modern web integration:
- Simplified Data Upload: Making it easier for users to bring their own data into the platform for analysis.
- Public Sharing of Plots: Facilitating collaboration and dissemination of insights by allowing users to share their generated visualizations.
- Integration as a React Component: This update makes UpSet more easily integratable into modern web applications and dashboards, aligning with contemporary web development practices.
These enhancements solidify
UpSet's position as a forward-thinking tool, capable of handling large datasets—up to 50,000 elements—with features like horizon graphs for varying scales and collapsible aggregates to manage visual complexity. The future looks bright for the
UpSet plot, promising even greater accessibility and utility for researchers tackling increasingly complex data challenges.
Practical Tips for Utilizing UpSet Plots
To harness the full power of an
UpSet plot, consider these practical tips:
- Know Your Data: Before diving in, understand the sets you're working with and the questions you aim to answer about their overlaps. What are you looking to discover? Largest intersections? Unique elements?
- Start Simple, Then Refine: For very large numbers of sets, begin with a high-level view (e.g., sorting by degree) and then progressively refine your analysis using filters and more specific sorting options.
- Leverage Interactivity: Don't just look at the static image. Interact with the plot! Click on intersection bars to highlight elements, sort the matrix, and explore different aggregations. This is where the true value of UpSet lies.
- Contextualize with Element Attributes: Make full use of the element view. Visualizing additional attributes (e.g., age, score, gene expression levels) for elements within specific intersections can reveal deeper insights into *why* those intersections are significant.
- Consider Data Preparation: Ensure your data is in a suitable format (e.g., a binary matrix indicating set membership or a list of set memberships per element). Clear and consistent naming of sets is crucial for readability.
The
UpSet plot's ability to provide precise quantitative insight into multi-set overlaps makes it an indispensable tool for diverse fields. For instance, in genomics, it can reveal which genes are expressed in multiple conditions or which pathways are commonly affected by different treatments. In social network analysis, it helps identify groups of individuals who share multiple affiliations or interests. Its elegant solution to a complex problem makes the
UpSet plot a truly transformative visualization technique.
Conclusion
The
UpSet plot's journey over the past ten years has been nothing short of remarkable. From its innovative inception addressing a critical gap in data visualization to its recent recognition with the IEEE VIS Test of Time Award, it has consistently proven its worth as a robust, scalable, and intuitive tool for understanding complex set intersections. The continuous evolution, exemplified by UpSet 2.0, ensures that this award-winning visualization technique will remain at the forefront of data analysis, empowering researchers and analysts to uncover hidden patterns and derive meaningful insights from their multi-set data for many years to come.